Boost Your Trading Confidence: High Probability Trade Tips The GKT Way
- Justin Maxwell
- May 15, 2024
- 3 min read
Updated: Jun 29, 2024
Trading without a plan can feel scary, sometimes trading with a plan is challenging for newer traders. But when you put math and the charts in your favor, trading with confidence is easier!
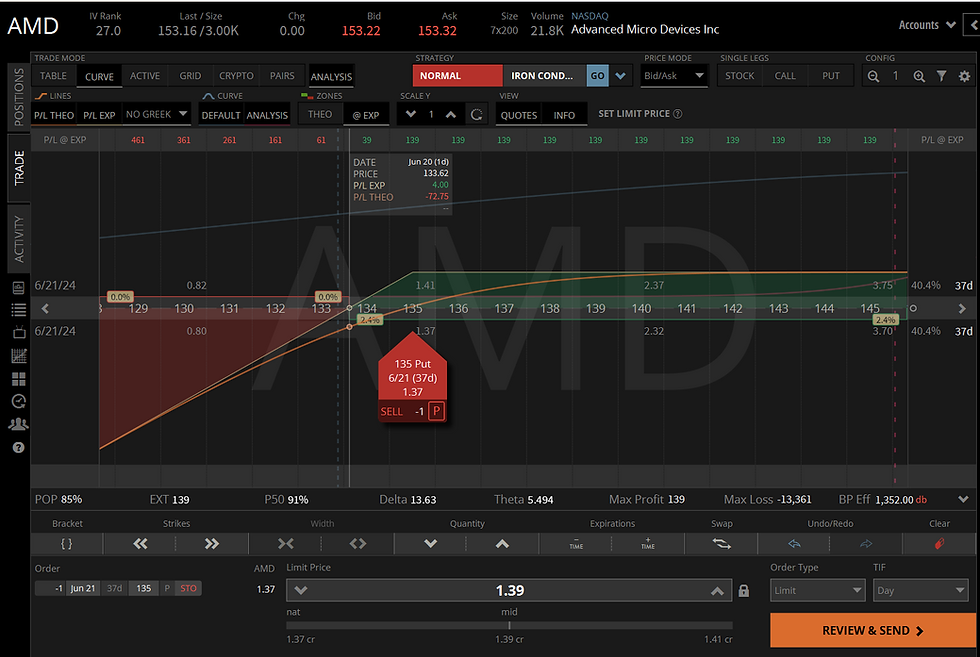
Tastytrade does a nice job of displaying the probability of profit for options trades. Do you see the two red box below?
The POP or (Probability of Profit) is the chance of your trade being profitable at expiration.
The P50 is the probability of the trade hitting a 50% of it’s maximum profit before expiration.
POP and P50 are calculated using a combination of historical data, mathematical models, and market analysis. I'm not going into that level of detail here, I can't even begin to try if I wanted!
Lets look at the risk curve. Tastytrade also does a nice job of showing you where the share price of AMD can close for you to be profitable, and where you start losing money. The green shaded area is profits. So above if AMD closes above 133.62 you make money. Below you lose money on this put sale.
If you are a more experienced trader this is all simple, you know all this. For our newer traders it might still be a little fuzzy. That's why you should ask questions in the discord thread for this blog! Not a member of our discord? You should be!
The information above is a great indicator you are making a high probability trade but I don’t stop here.
I believe you can add technical analysis (looking at the charts) to add more “probability” or confidence to your trade.
Do you see on the daily chart below we have a 200 moving average (the thick red line I highlighted? It's at 139.32. So selling a 135 put makes sense!
Also checkout that purple box in the chart above from November to January. We have support and a moving average that should help support AMD if it suddenly drops. It looks like it could drop, the chart is a little heavy looking after all, but it's all above the 135 put we are considering selling.
I always think you should zoom out! Let's look at the weekly chart. Do you notice I've highlighted two similar looking features in the chart below?
We have a 50 EMA (enhanced moving average) on the weekly that at 141.41 slightly above the 200MA on the daily. This is extra confidence. I see support around 130 on this chart.
Don't just look at the chart, think about liquidity and return as well!
Consider the premium received the orange boxes above. Ideally I want 1% for every 30 days so the 135 put is paying more than 1.35
The option has plenty of liquidity as shown by the red box.
The green box shows the bid ask spread is acceptable. You can sell a put for around 1.37 and you can buy a put for around 1.41. Of course we want the mid price...
I’m willing to make accommodations for these factors based on how much I like the stock. This meets the 1%, the option is liquid and it has a nice bid ask spread!
Just because this is a high probability trade, I don't want you to be mislead. This trade may not work. Even though we have built up a good thesis to why this is a high probability trade the 10% chance it doesn't hit 50% is real.
But if you are selling a put you can let the put expire in the money and take shares of AMD at a discount and a nice level where there is support. You can turn this into a wheel trade.
If you can’t afford to take the shares, you would want to close this if it closes below the moving averages. Remember you always need a plan for your trades.
What I’ve shown you today is how I build an even higher probability trade that gives me more confidence in taking my trades. This is an example with a short put, but you can do this same thing with defined risk trades as well!
Do you want to learn how I underwrite a stock trades similar to how real estate investors underwrite real estate deals. I'm hosting a webinar,
Join GKT Newsletter, or if you are really serious I'll see you in discord much sooner.
Happy Trading Good Kids!
I provide all of this to you for free. If you enjoy this, perhaps you'd consider buying me a coffee. If you have feedback please let me know. I'm here for you!
None of this is trading advice, it's for your education in hopes you can make money in the market as I have done. I’m basically just some dude on the internet who’s been trading 2 decades, and I use the stock market as my primary source of income. None of this is financial advice it’s purely educational!


Comments